


What You'll Learn:
- What AST:ALT ratio tells you
- How to get your AST:ALT ratio numbers
- How to calculate your AST:ALT ratio
- What different ratio values indicate
- When the ratio points to alcohol-related stress vs other causes
- Why you want to track your AST:ALT ratio over time
The AST:ALT ratio is one of the most useful tools for interpreting liver enzyme results. Also known as the De Ritis ratio, this calculation has been used since 1957 to help differentiate between types of liver disease. While individual AST and ALT numbers tell part of the story, the ratio between them often reveals more about what is happening inside your liver.
How to Get Your AST:ALT Ratio Numbers
At one point you would have had to schedule an appointment with a physician, paid a co-pay for the visit, gotten a doctor’s recommendation, go to a lab for a blood draw and then wait for the results that aren’t interpreted at all.
You can still do all that, or you can order an at-home liver test from a provider like Choose Health that offers just as much accuracy and a lot more convenience. Today, many people who are curious about their liver health and want to know if they need to get help from a doctor choose to take an at-home test. It provides valuable information that you can use to know if further care is needed rather than going through that hassle when it may be unnecessary.
Need to get your AST:ALT ratio numbers? Choose Health has two liver tests that can provide your AST:ALT ratio.
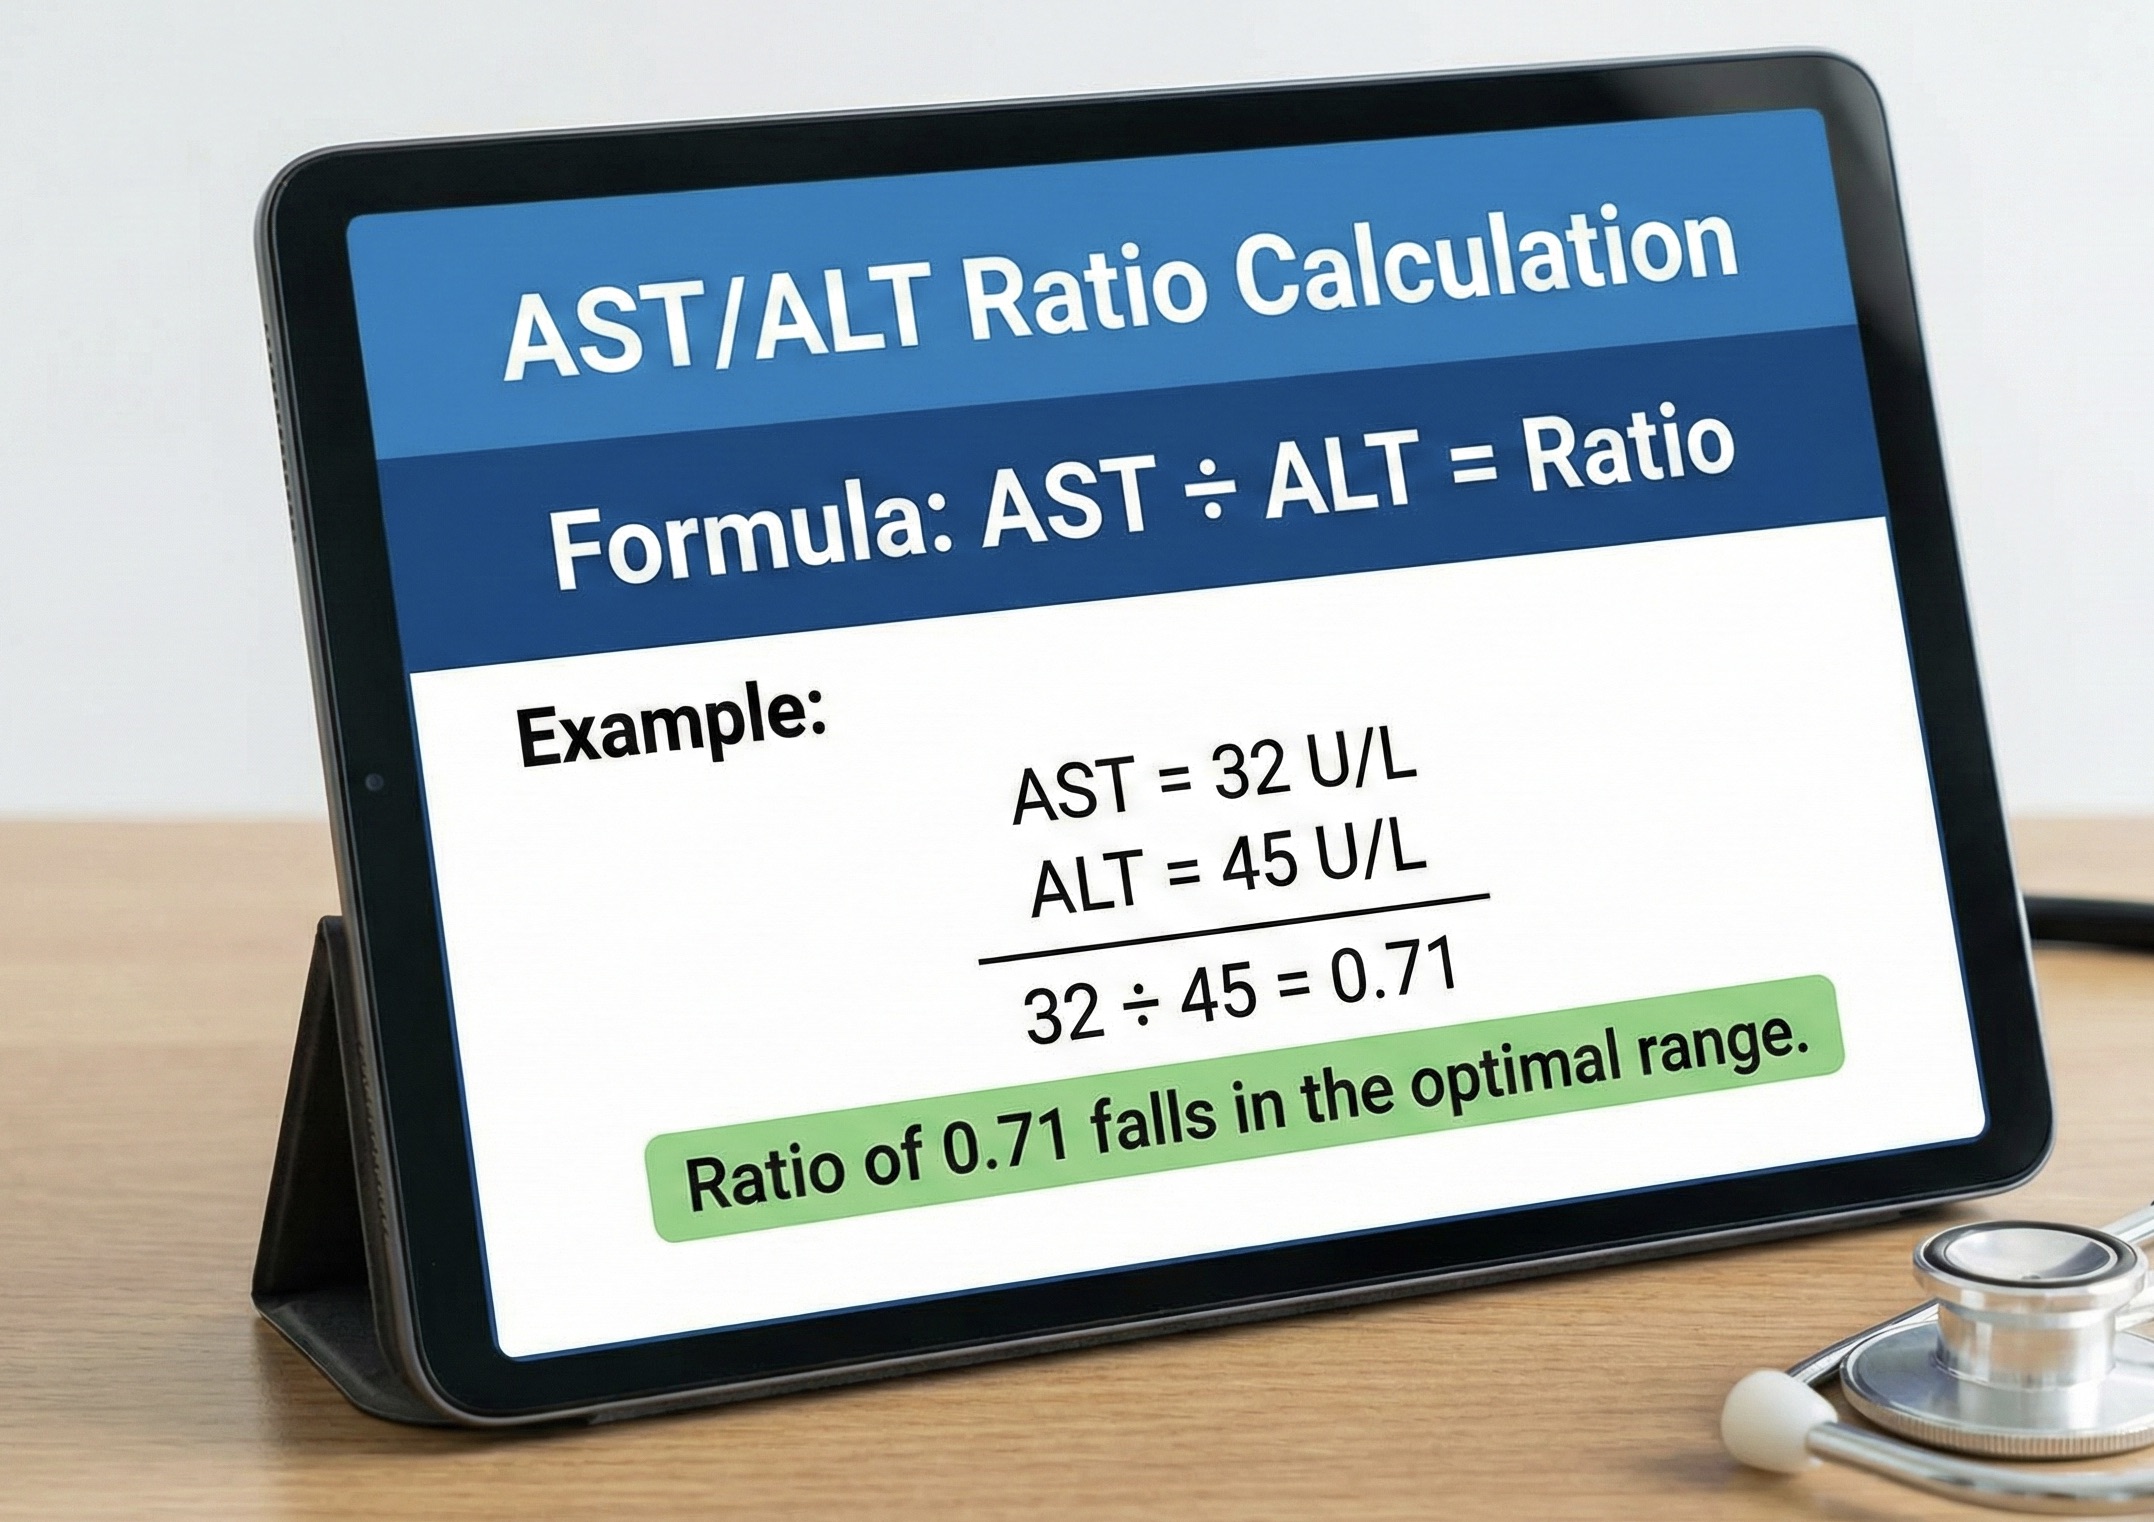
How to Calculate Your AST:ALT Ratio Without Doing the Math Yourself
We’ve created a calculator that makes it remarkably easy to calculate AST:ALT ratio and know if it’s within a healthy range.
Formula: AST ÷ ALT = Ratio
For example, if your AST is 32 U/L and your ALT is 45 U/L:32 ÷ 45 = 0.71
That ratio of 0.71 falls in the optimal range.

What Your AST:ALT Ratio Means Beyond Established, Generic Benchmarks
Knowing the ratio doesn’t do you much good if you don’t know what the result indicates. Here is how to interpret your results based on well-established benchmarks:
Ratio Below 1 (Optimal)
A ratio below 1 means your ALT is higher than your AST. This pattern is typical of metabolic-related liver stress, including what was previously referred to as fatty liver disease, now called metabolic dysfunction-associated steatotic liver disease (MASLD, formerly NAFLD), insulin resistance, or medication effects. Most people with early-stage liver concerns fall into this category.
Ratio of 1 (Borderline)
When AST and ALT are roughly equal, it’s a sign of early stage MASLD. It may also indicate insulin resistance, acute viral hepatitis or drug-related liver toxicity since this pattern often appears during active liver cell damage from infections or certain medications. Most people with early-stage liver concerns fall into this category.
Ratio Between 1 and 2
A ratio in this range suggests progression beyond simple fatty liver. According to research from the NIH, the AST/ALT ratio correlates with the presence of cirrhosis, with ratios approaching 1 or higher often indicating more advanced liver changes.
Ratio Above 2 (Highly Elevated)
A ratio greater than 2, where AST is more than double ALT, strongly suggests alcohol-related liver disease. This pattern becomes even more significant when GGT is also elevated. Research published in the American Journal of Gastroenterology found that patients with alcoholic liver disease had a mean ratio of 2.6, compared to 0.9 in those with MASLD.
Why the Ratio Matters More Than Individual Values
You may be wondering if the ratio really matters if you have your AST number and your ALT number. While often the individual biomarker metrics are what’s important, in this case measuring the two against each other provides more valuable insight.
Looking at AST or ALT alone can be misleading. Someone with AST of 60 and ALT of 80 has a ratio of 0.75, pointing toward metabolic causes. Someone else with AST of 60 and ALT of 25 has a ratio of 2.4, pointing toward alcohol-related stress, despite having the same AST value.
The ratio also helps track whether liver stress is improving or progressing. A ratio moving from 1.5 toward 0.8 over several months suggests recovery. A ratio moving from 0.9 toward 1.5 warrants intervention to address liver stress.
Who Can Benefit the Most From Calculating Their AST:ALT Ratio
Anyone can gain important information about their health through AST:ALT ratio monitoring, but for some people calculating the ratio is highly beneficial. You’ll want to know your AST:ALT ratio if you:
- Drink alcohol regularly and want to monitor liver impact.
- Have been diagnosed with MASLD and want to track changes.
- Take medications that are processed by the liver.
- Have metabolic concerns like insulin resistance or high triglycerides.
- Want baseline data for long-term health monitoring.
The best part is monitoring your AST:ALT ratio can provide all of these benefits simultaneously.
How Often AST:ALT Ratio Should Be Tested
Taking one at-home liver enzyme test provides valuable information. But taking follow-up tests helps you track your progress to know what changes are having the biggest impact on your health. Plus, there are things like acute stress or dehydration that can temporarily cause elevated AST or ALT.
How often you should retest depends on your situation:
When GGT Changes the Ratio Reading
GGT (gamma-glutamyl transferase) adds another layer to ratio interpretation. According to research on alcoholic liver disease diagnosis, combining the AST:ALT ratio with GGT levels creates a more complete picture of liver health.
GGT is an enzyme that’s mostly produced in the liver. It’s there to help protect your organs when medications and toxins are metabolized. Measuring GGT helps evaluate liver function and detect diseases.
An AST:ALT ratio above 2 with elevated GGT strongly indicates alcohol-related liver stress. The same ratio with normal GGT might point toward other causes like muscle injury affecting AST levels.
AST:ALT Ratios and GLP-1 Medications
Anyone who is using GLP-1 medications like semaglutide and tirzepatide should be tracking liver enzymes during their weight loss journey. Rapid fat loss can temporarily shift ALT and AST levels as the liver adapts metabolically. In many people with MASLD, liver markers improve over time alongside reductions in visceral fat and insulin resistance.
Measuring AST:ALT ratio is another way to determine the effectiveness of GLP-1 medications and make sure that shifts in ALT and AST levels have adjusted back to normal.
Why More People Are Using At-Home Liver Testing
Choose Health offers comprehensive at-home liver function tests that measure AST, ALT, and GGT together as accurately as a doctor’s office with some extra benefits. Testing from home allows you to:
- Get your ratio without a doctor’s recommendation
- Avoid scheduling and making a trip to the doctor’s office
- Have results sent to you with explanations
- Track changes over time through your dashboard
- See how lifestyle changes affect your liver markers
- Detect early patterns before symptoms appear
With our tests the results include your calculated ratio for straightforward accuracy along with personalized insights based on your enzyme patterns.
Choose Health doesn’t just give you the numbers. We provide support and in-depth information on how to interpret your results. Within our platform you are able to track the results of all your tests to see the complete picture in a comprehensive way.
Find Out How Your Liver is Functioning With an Easy, Accurate At-Home Test!
Next Steps After Getting Your AST:ALT Ratio Results

.jpeg)