
.png)



Cholesterol is found in every cell in your body. This waxy substance supports a lot of biological functions, including hormone production and building cell membranes. It can also be a case of too much of a good thing.
There are two forms worth understanding.
The helpful one
HDL cholesterol
High-density lipoprotein travels from other parts of the body back to the liver to be removed. Higher HDL is associated with lower risk of heart disease.
The harmful one
LDL cholesterol
Low-density lipoprotein builds up in arteries and creates plaque, which raises the risk of stroke or heart attack.
Your cholesterol ratio compares those two. It's calculated from your total cholesterol and your HDL, both measured in milligrams per deciliter.
The calculation
Total cholesterol ÷ HDL = your ratio A lower number is better, because it means more of your total is HDLRunning the calculation is the easy part. Interpreting it takes knowing what counts as a good ratio, what counts as a bad one, and which factors move it most. Two derived values are worth understanding alongside it, non-HDL cholesterol and VLDL cholesterol.

What counts as a good cholesterol ratio
The ratio compares your HDL against your total cholesterol. You want HDL as high as possible, which means a good ratio is a low one. The American Heart Association puts an ideal ratio at 3.5 or below, though most clinicians treat anything under 4 as good and 4 to 5 as acceptable.
| Measure | Target | What it means |
|---|---|---|
| Cholesterol ratio | 3.5 or below | Ideal. Under 4 is good, 4 to 5 is acceptable |
| HDL | 40 to 59 mg/dL | Normal. Higher is better |
| LDL | At or below 100 mg/dL | No optimal level exists. Lower is better |
What counts as a bad cholesterol ratio
There's less agreement here. Everyone accepts that 3.5 or below is very good. In recent years some clinicians have argued the threshold for concern should sit higher than it once did.
A ratio above 4 used to be the warning line. The Texas Heart Institute now recognizes 4.5 as the threshold, and some physicians consider 5 or below to be normal.
Looking at each number individually tells a different story. HDL below the 40 to 59 mg/dL range is a problem, and LDL above 100 mg/dL isn't where you want to be.
What influences your ratio most
Sex
Sex has a significant effect. Women generally carry higher HDL, which is why both the ideal ratio and the HDL target differ. Women should aim for HDL at 50 mg/dL or higher and a ratio of 4 or below. Men should aim for HDL at 40 mg/dL or higher and a ratio of 5 or below.
Age
Cholesterol tends to rise over time. Age affects men more than women until menopause, after which the risk of high cholesterol increases with age for women too. With a family history of high cholesterol, tracking should start early. Some experts recommend testing from as young as two years old.
Diet
What you eat moves these numbers meaningfully. Unfiltered coffee, refined carbohydrates and alcohol can raise LDL and worsen your ratio. To improve it, focus on healthy fats, soluble fiber, omega-3 fatty acids, fruits and vegetables, while limiting high-cholesterol and high-salt foods.
Exercise
People who exercise regularly tend to have better ratios, and studies have shown exercise can lower LDL. The general recommendation for adults is at least 150 minutes of moderate physical activity per week.
Smoking
Smoking tends to raise LDL and lower HDL at the same time, which moves the ratio in the wrong direction from both ends. Cholesterol levels generally improve after quitting, both in the near term and over the long run.
Underlying health conditions
An existing condition may be contributing. Diabetes and high blood pressure are both known to raise cholesterol ratio, which is one reason metabolic markers are worth seeing alongside a lipid panel rather than on their own.
.jpeg)
Where to go from here
A ratio on its own is a summary, and summaries hide things. The same 4.2 can come from high HDL with high LDL or from modest numbers on both sides, and those two situations call for different responses.
That's the case for seeing the individual values rather than just the ratio, and for reading them alongside the metabolic markers that influence them. Diabetes and blood sugar control affect cholesterol directly, which is why glucose, insulin and HbA1c belong in the same picture.
20+ biomarkers · DBS finger-prick
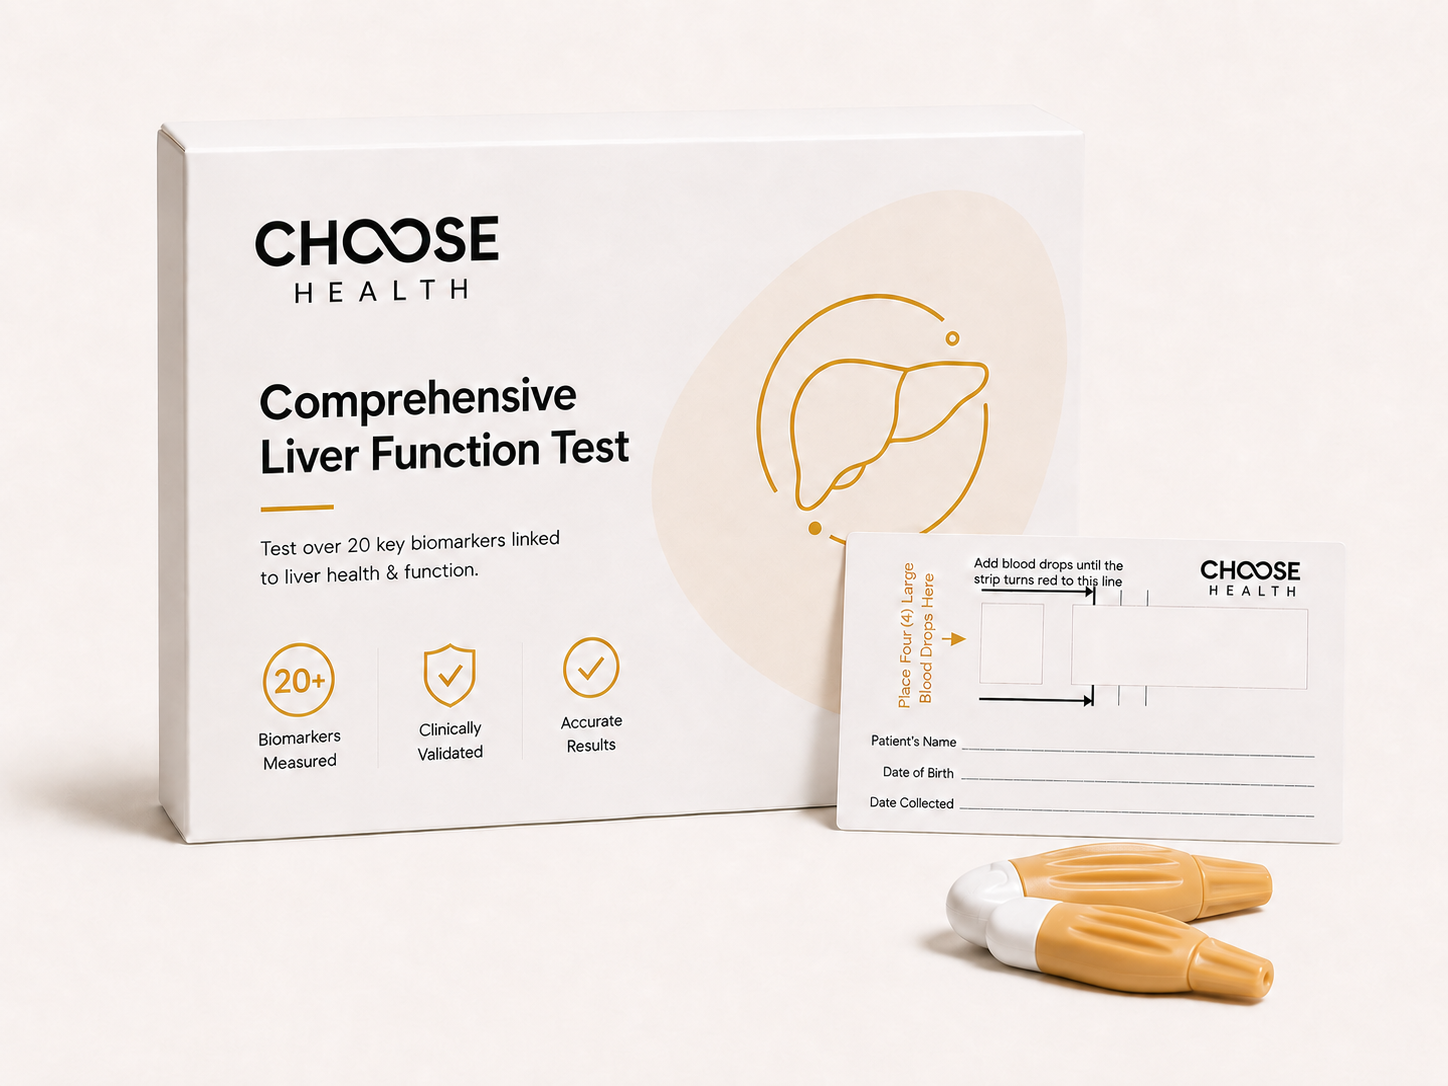
Comprehensive Liver Function Test
Your full cholesterol profile alongside the liver and metabolic markers that influence it, from one finger-prick sample.
- Cardiovascular
- HDL, LDL, triglycerides, ApoA, ApoB
- Metabolic
- Fasting glucose, fasting insulin, HbA1c
- Liver
- Albumin, AST, ALT, GGT, total bilirubin
- Iron
- Iron status
At-home finger-prick collection. Results in days.
This article is for informational purposes and is not a substitute for medical advice, diagnosis or treatment. Reference ranges vary between laboratories and guidelines. Discuss your results with your healthcare provider.
.png)