



What you'll learn
- How insulin resistance causes fat buildup in the liver
- Why fatty liver makes insulin resistance worse
- Which markers reveal this metabolic connection
- How to track both liver and metabolic health together
How insulin resistance affects your liver
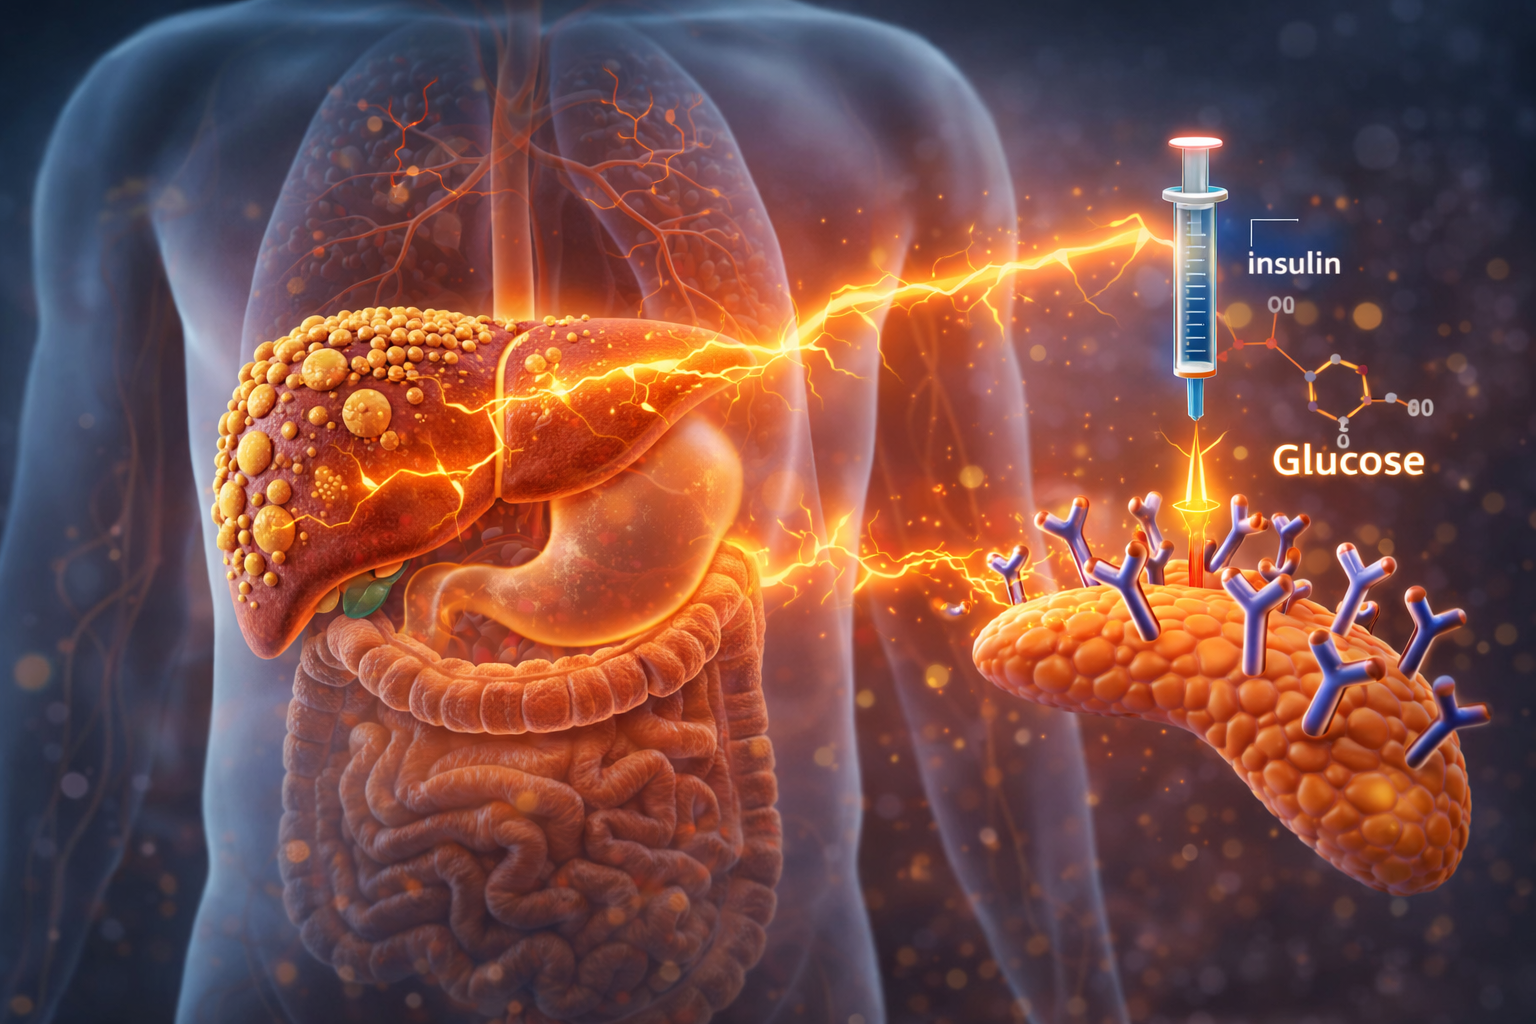
When your cells become resistant to insulin, your body compensates by producing more of it. High circulating insulin then triggers three problems in the liver at once.
Insulin tells the liver to make fat
Elevated insulin signals the liver to convert excess glucose into fat. This process, called de novo lipogenesis, increases dramatically in insulin-resistant states, and the fat accumulates inside liver cells.
The liver loses metabolic flexibility
Normally the liver switches between burning glucose and burning fat depending on what's available. Insulin resistance disrupts that flexibility, so the fat it's accumulating doesn't get used.
Stored fat stays stored
High insulin prevents the release of fat from adipose tissue. That sounds like it would reduce liver fat, but it backfires: the liver synthesizes more fat internally because it can't draw on fat from other storage sites.
And fatty liver makes insulin resistance worse
The relationship runs both directions. Once fat accumulates in liver cells, it actively promotes insulin resistance.
Research from Yale University found that hepatic fat content is the strongest predictor of insulin resistance in patients with fatty liver disease. Specifically, a fat molecule called diacylglycerol accumulates in liver cells and interferes with insulin signaling.
The cycle
- Insulin resistance increases liver fat
- Liver fat worsens insulin resistance
- Worsening insulin resistance increases liver fat further
- The cycle continues unless something interrupts it
Breaking it requires addressing both problems at once. Weight loss, exercise and dietary change improve liver fat and insulin sensitivity together, and reducing alcohol removes one of the loads the liver is carrying while it does.

Where these problems overlap
Studies show substantial overlap between fatty liver and metabolic dysfunction.
The metabolic dysfunction driving fatty liver usually shows up in blood markers before symptoms appear. That's what makes testing worth doing early, particularly with risk factors like abdominal obesity, a family history of diabetes or elevated triglycerides.
Which markers reveal the connection
Liver markers
| Marker | Optimal | Elevated |
|---|---|---|
| ALT (men) | <55 U/L | 56 to 110 U/L |
| ALT (women) | <45 U/L | 46 to 90 U/L |
| GGT (men) | <14 U/L | 14 to 27 U/L |
| GGT (women) | <9 U/L | 9 to 17 U/L |
Metabolic markers
| Marker | Optimal | Concern |
|---|---|---|
| HbA1c | <5.6% | 5.6 to 6.4%, prediabetic range |
| Fasting glucose | <100 mg/dL | 100 to 125 mg/dL |
| Triglycerides | <150 mg/dL | 150 to 200 mg/dL |
Elevated GGT alongside a borderline HbA1c is the combination that suggests the liver and insulin resistance connection is already active. Either one alone is easier to explain away. Together they're a signal.
Why ALT and GGT rise before blood sugar
Liver enzymes often elevate years before blood sugar markers change. Research indicates ALT and GGT predict future diabetes risk even when fasting glucose still reads normal.
This happens because the liver is the first organ to take on metabolic stress from insulin resistance. By the time blood sugar rises enough to flag as prediabetic, the liver has usually been accumulating fat for years.
Testing liver enzymes alongside HbA1c and fasting glucose catches the dysfunction earlier, and earlier is when it's easiest to reverse.
See both sets of markers together
ALT, AST and GGT alongside fasting glucose, fasting insulin, HbA1c and triglycerides, from one finger-prick sample.
Breaking the cycle
Weight loss of just 5 to 10% often produces significant improvement in both liver fat and insulin sensitivity. What works:
- Reducing refined carbohydrates and added sugars
- Increasing physical activity, both cardio and resistance training
- Prioritizing sleep, since poor sleep worsens insulin resistance
- Managing stress, since cortisol impairs insulin sensitivity
Most people see liver enzymes improve within 4 to 8 weeks of consistent change. Metabolic markers like HbA1c take longer, usually 2 to 3 months, because HbA1c reflects an average over that period rather than your current state.
Track both together
Because liver and metabolic health are this interconnected, tracking them separately gives you half an answer twice. Testing both sets every 3 to 6 months shows whether what you're doing is working, and which side is responding first.
Many people feel better before their numbers fully normalize. That's encouraging and it's not the finish line. The goal is getting the markers into optimal range and keeping them there.
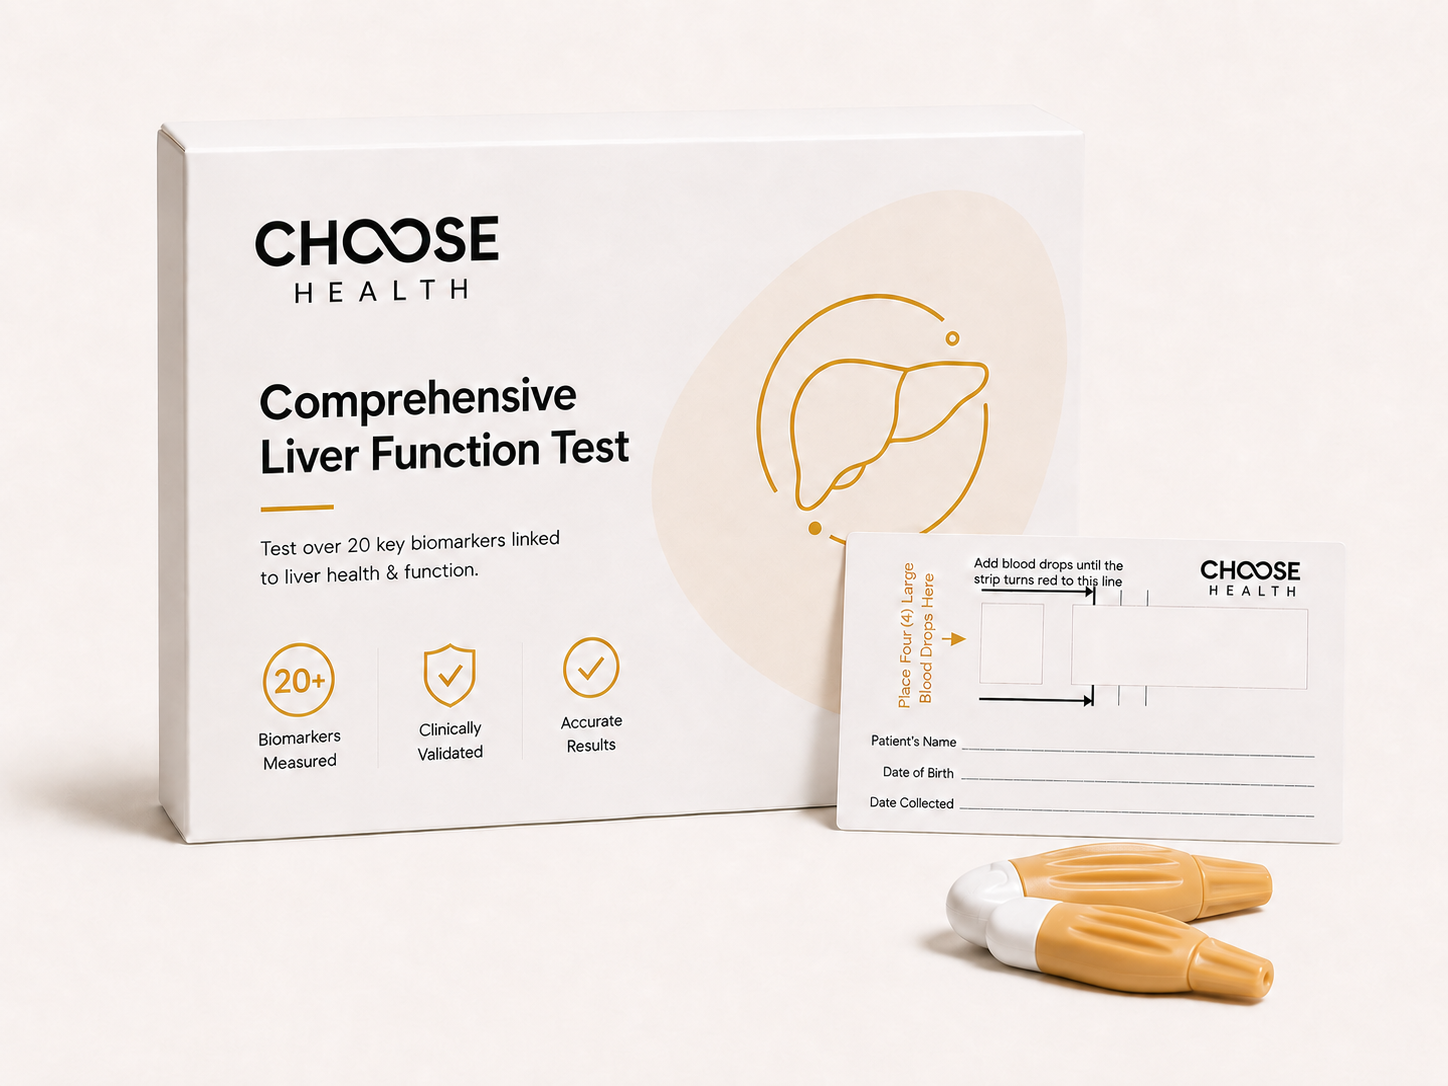
20+ biomarkers · DBS finger-prick
Comprehensive Liver Function Test
Both sides of the connection in one finger-prick sample, with HOMA-IR and the Fatty Liver Index returned as calculated scores.
- Liver
- Albumin, AST, ALT, GGT, total bilirubin
- Metabolic
- Fasting glucose, fasting insulin, HbA1c, HOMA-IR
- Cardiovascular
- HDL, LDL, triglycerides, ApoA, ApoB
- Calculated scores
- Fatty Liver Index, Hepatic Steatosis Index, AST:ALT ratio
At-home finger-prick collection. Results in days.
This article is for informational purposes and is not a substitute for medical advice, diagnosis or treatment. Reference ranges vary between laboratories and guidelines. If you are managing diabetes or taking medication that affects blood sugar, discuss any dietary or activity changes with your healthcare provider first.
.jpeg)


.jpeg)